
Vlizlib | Customized Data Visualization & Reporting Solutions for Qlik Sense
Unlock the True Power of Qlik Sense
How Vizlib Helps
More Than Visuals – Enhance your Qlik investment with advanced capabilities like Self-Service, Writeback, Finance, Gantt, and customized app solutions.
Smooth Migration to Qlik Cloud – Enhance your Qlik Cloud analytics with over 40 intuitive visualizations, no-code integration, and full compatibility for a streamlined experience.
Enhanced Team Collaboration – Collaborate effortlessly with interactive writeback capabilities. Edit data directly in dashboards, add comments and notes, and share insights easily via exports or embedded analytics.

Features
Vizlib Library
Vizlib Library offers a highly intuitive user experience designed for all users—not just developers. It helps teams save significant development time by enabling users to turn data into compelling stories and deliver impactful, data-driven business solutions.
With Vizlib Library, you can:
-
Create, save, and share designs with Vizlib Templates
-
Run predictive models using Advanced Analytics
-
Build guided analytics journeys with Vizlib Actions
-
Enhance drill-downs with customized charts using Vizlib Viztips
Vizlib Self-Service
Vizlib Self-Service enables users at any level to independently explore data, gain faster insights, and make confident, informed decisions.
With Vizlib Self-Service, you can:
-
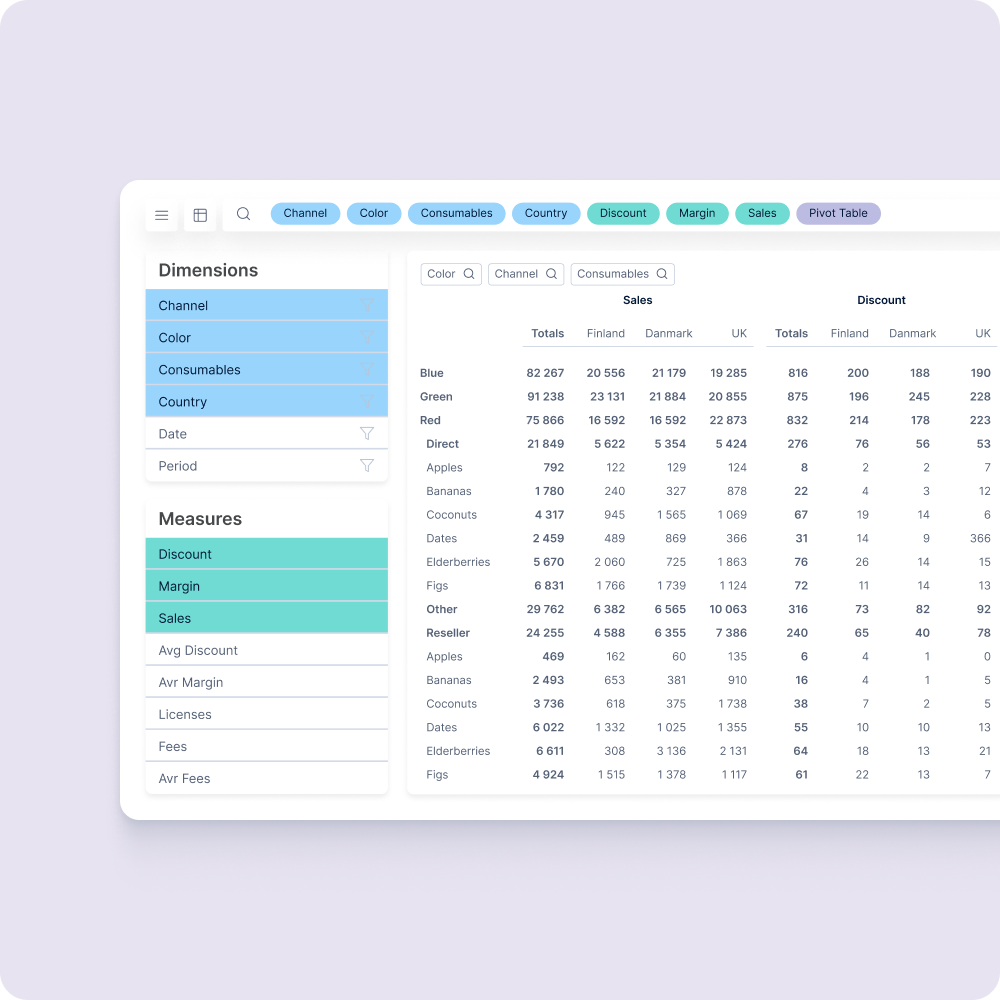
Use Vizlib Analytic Search for easy and intuitive data discovery
-
Apply Customizable Preset Themes to build visually appealing reports that match your brand
-
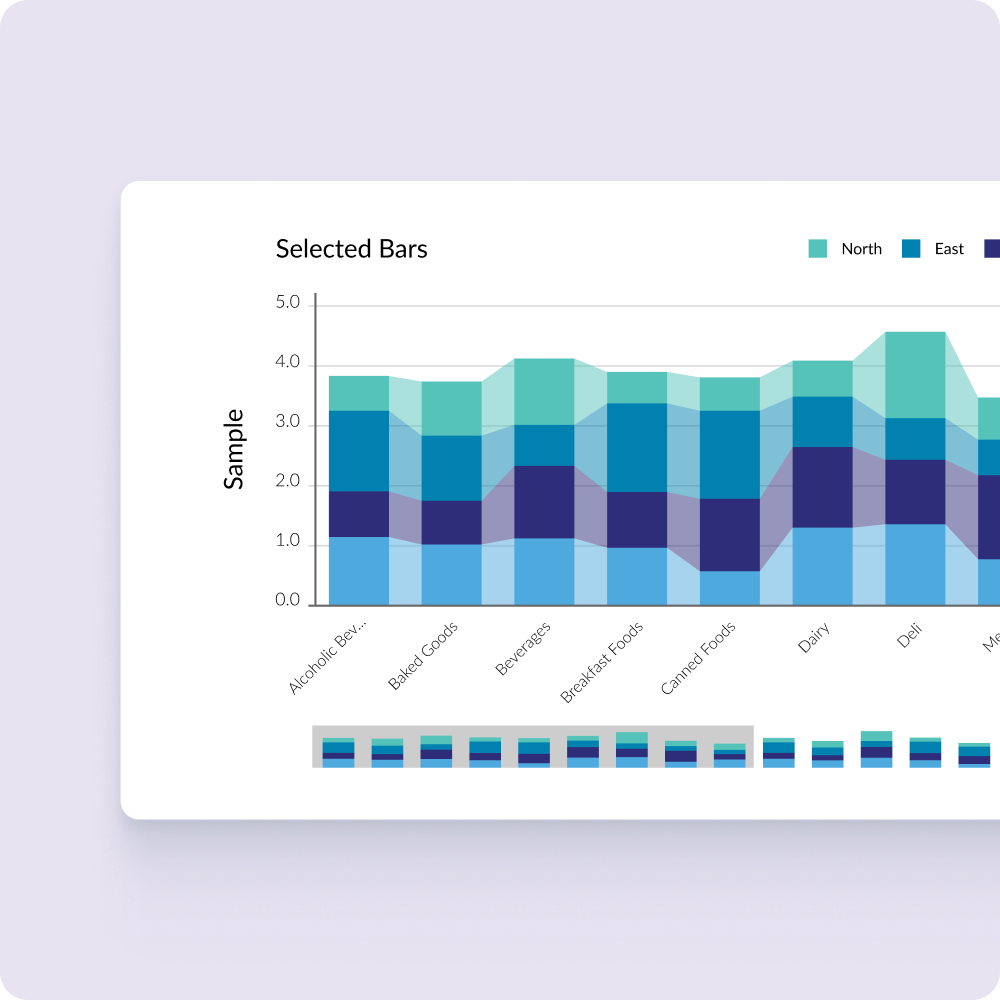
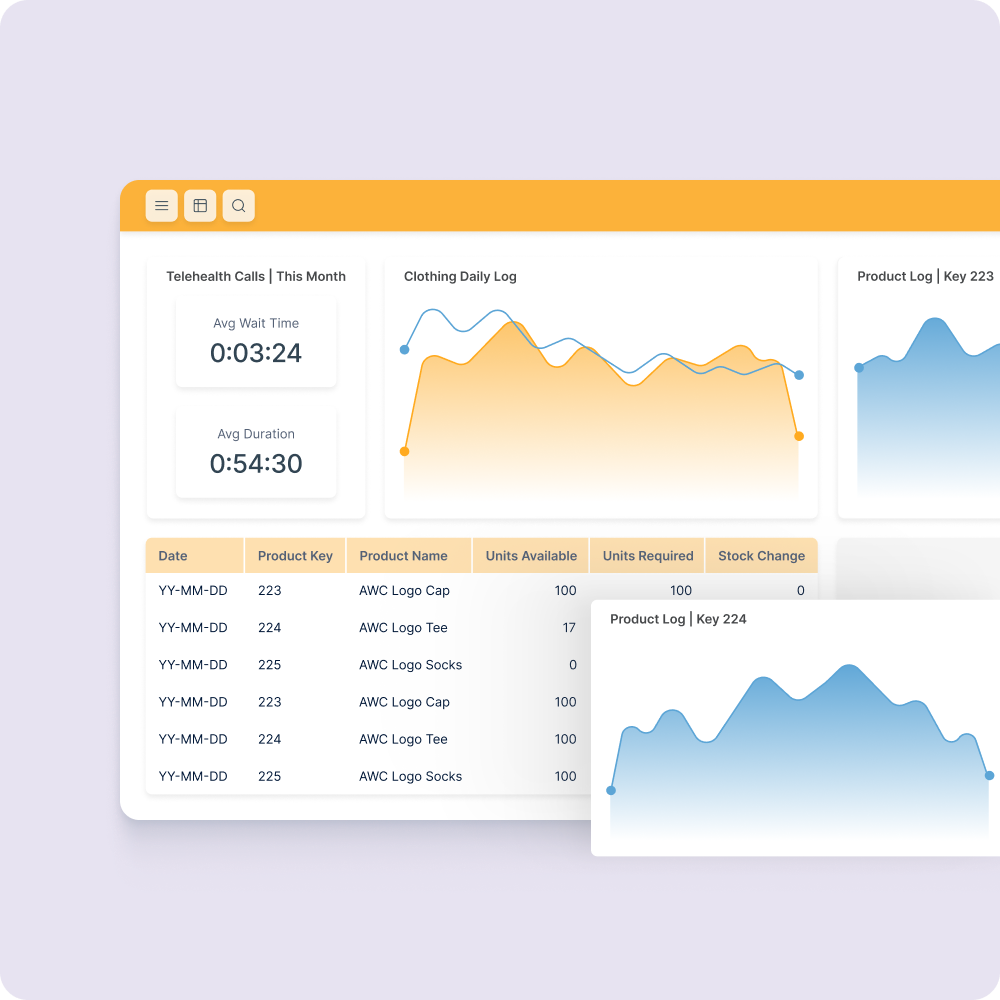
Leverage Visualizations in Custom Reports to turn data findings into meaningful, actionable insights
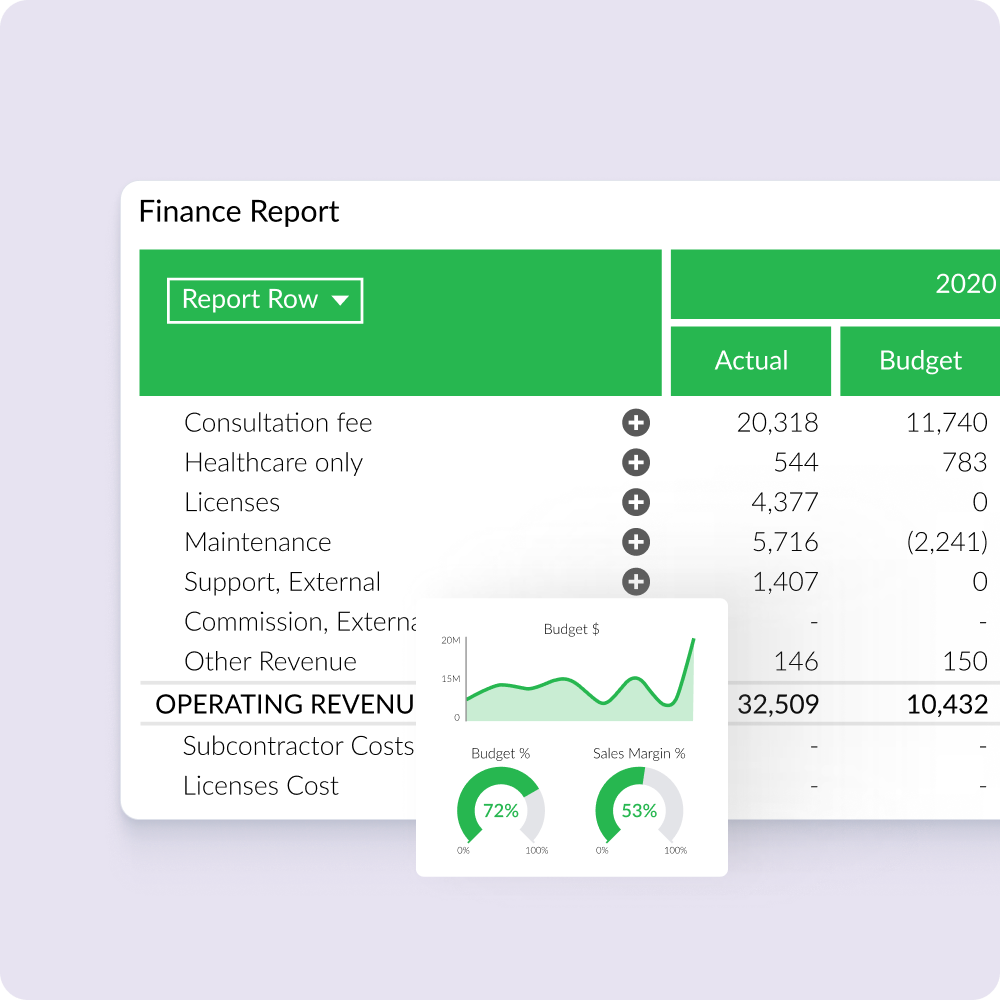
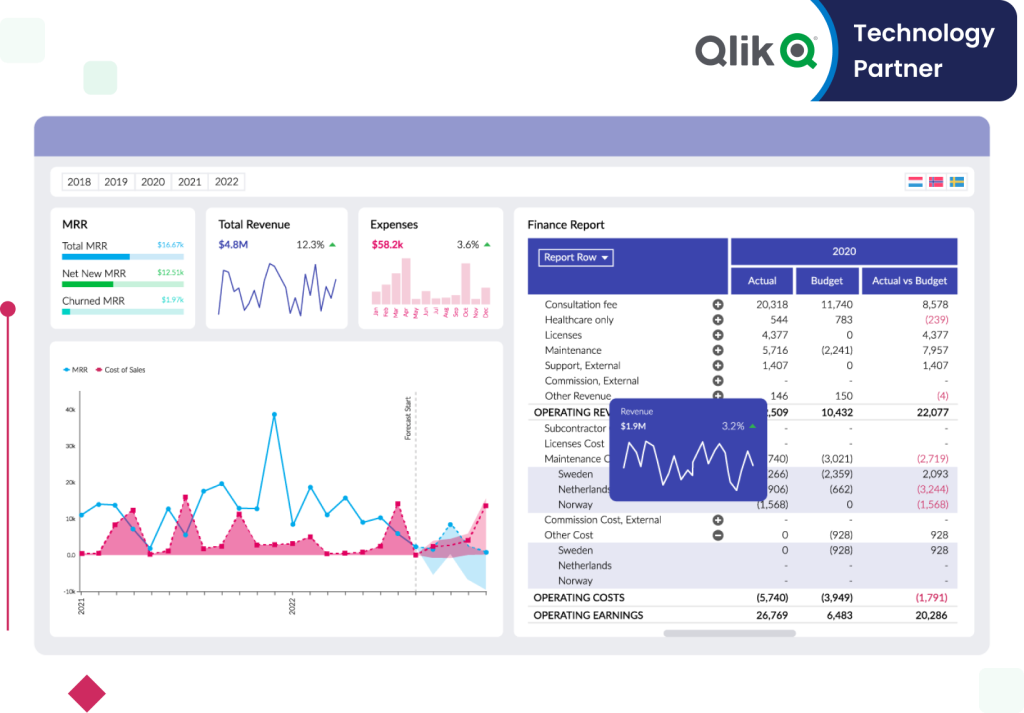
Vizlib Finance
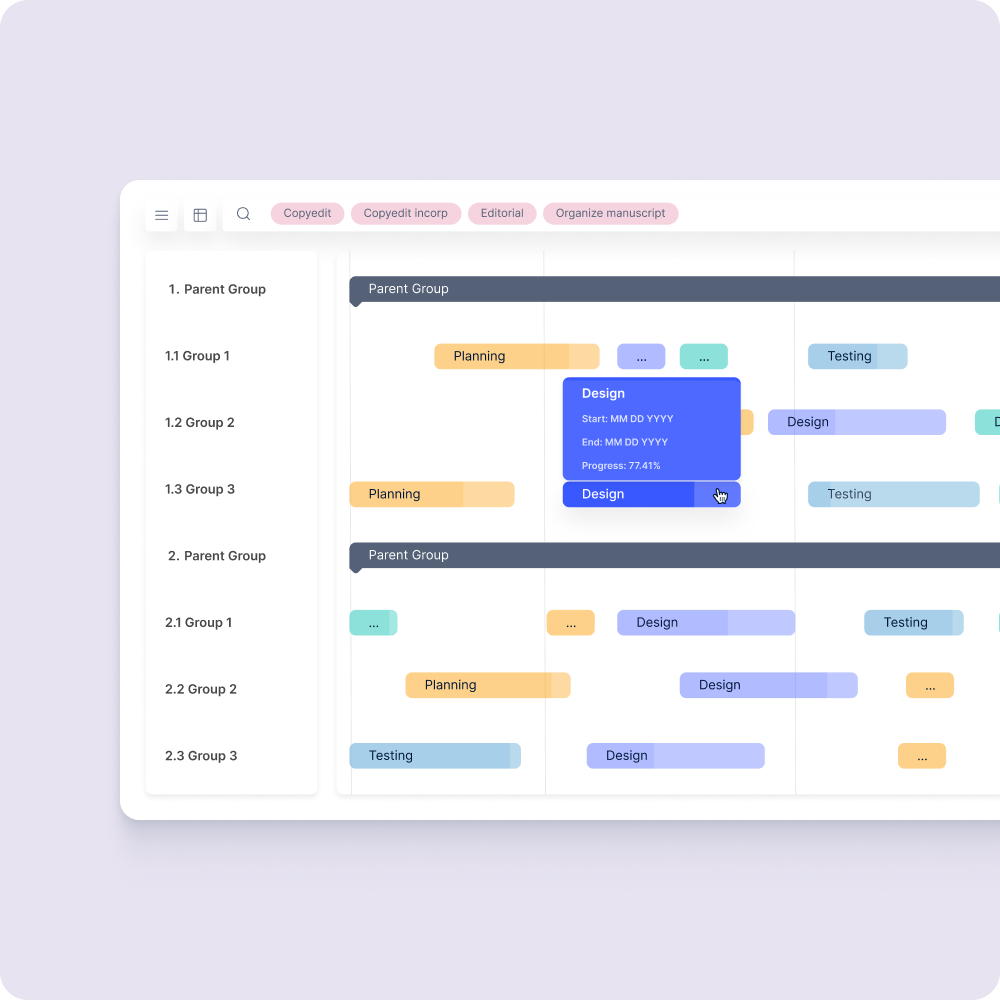
Vizlib Gantt
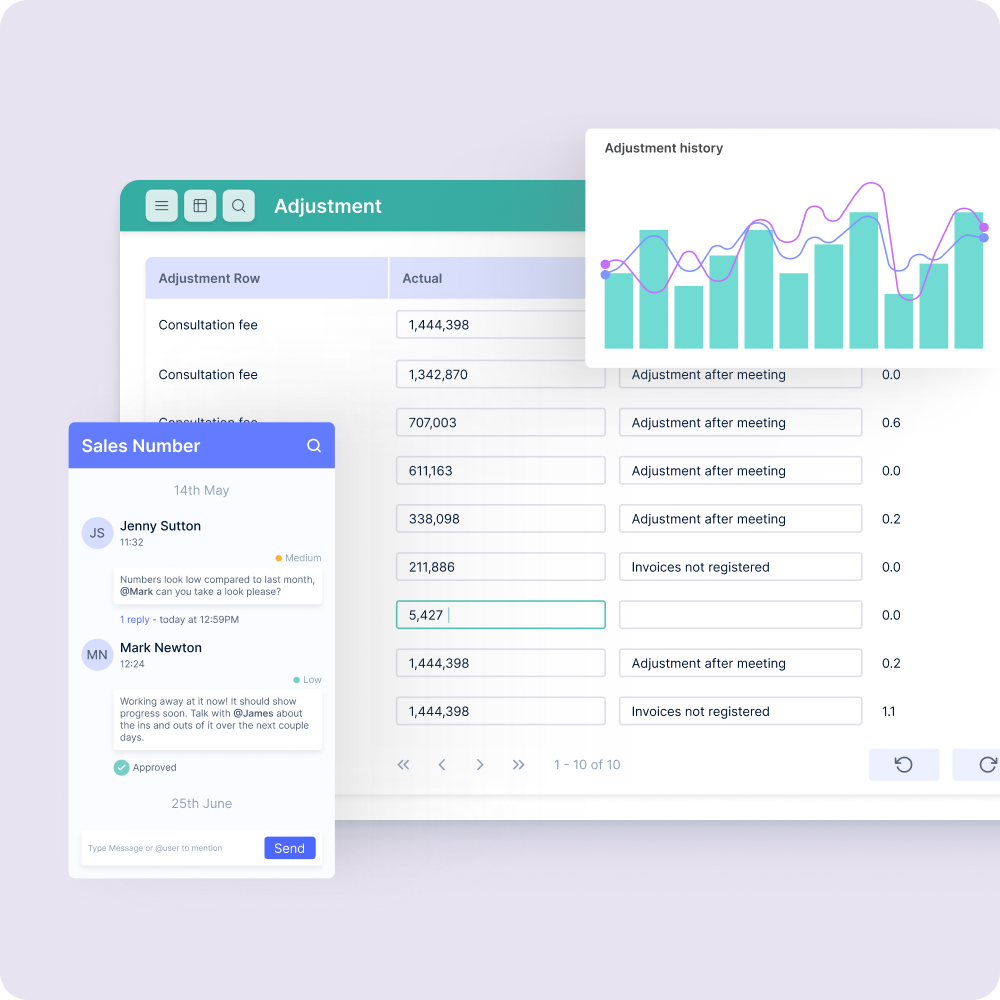
Vizlib Collaboration
Vizlib Live!
Integrations
Smooth Integration with ERP/EPM Systems, Live Data Feeds, and IT-Free Export Capabilities
Connect to Over 140 ERPs and EPMs to Export and Visualize Data—No IT Expertise Required